


The Ellsworth Kelly quilt, part 2
Math and quilts

I finished my Ellsworth Kelly quilt top last week and sent it off to my long armer for quilting. While I wait for it to return, I’ll continue the story of how it was made. If you’re new here, check out my last newsletter for the story of Ellsworth Kelly, who is the inspiration for this quilt design.
After I shared the initial glimpses of this project on Instagram, many folks messaged me to ask how I created a completely random assortment of colored squares that was also weighted in the center like some of Ellsworth Kelly’s designs. This newsletter will delve deeper into my process for creating that sort of organized randomness.

Ellsworth Kelly’s Spectrum Colors Arranged by Chance III
Let’s get nerdy
For his Spectrum series, Kelly said that he pulled numbers from a hat to choose which color to paint in any given square. But this does not fully explain how Kelly created his compositions. Not all of the works in this series use completely random color assignments, and several have colors concentrated in the center. Few resources explain how Kelly created these weighted distributions, only that for each work, Kelly used a “different process” to arrange colors.

I found one blog where the author trekked to the Stedelijk Museum in Amsterdam to access Kelly’s catalogue raisonné in search of more information on his process for this series. The author found some tantalizing clues about how Kelly thought about his grids, but nothing definitive on the systems he used.
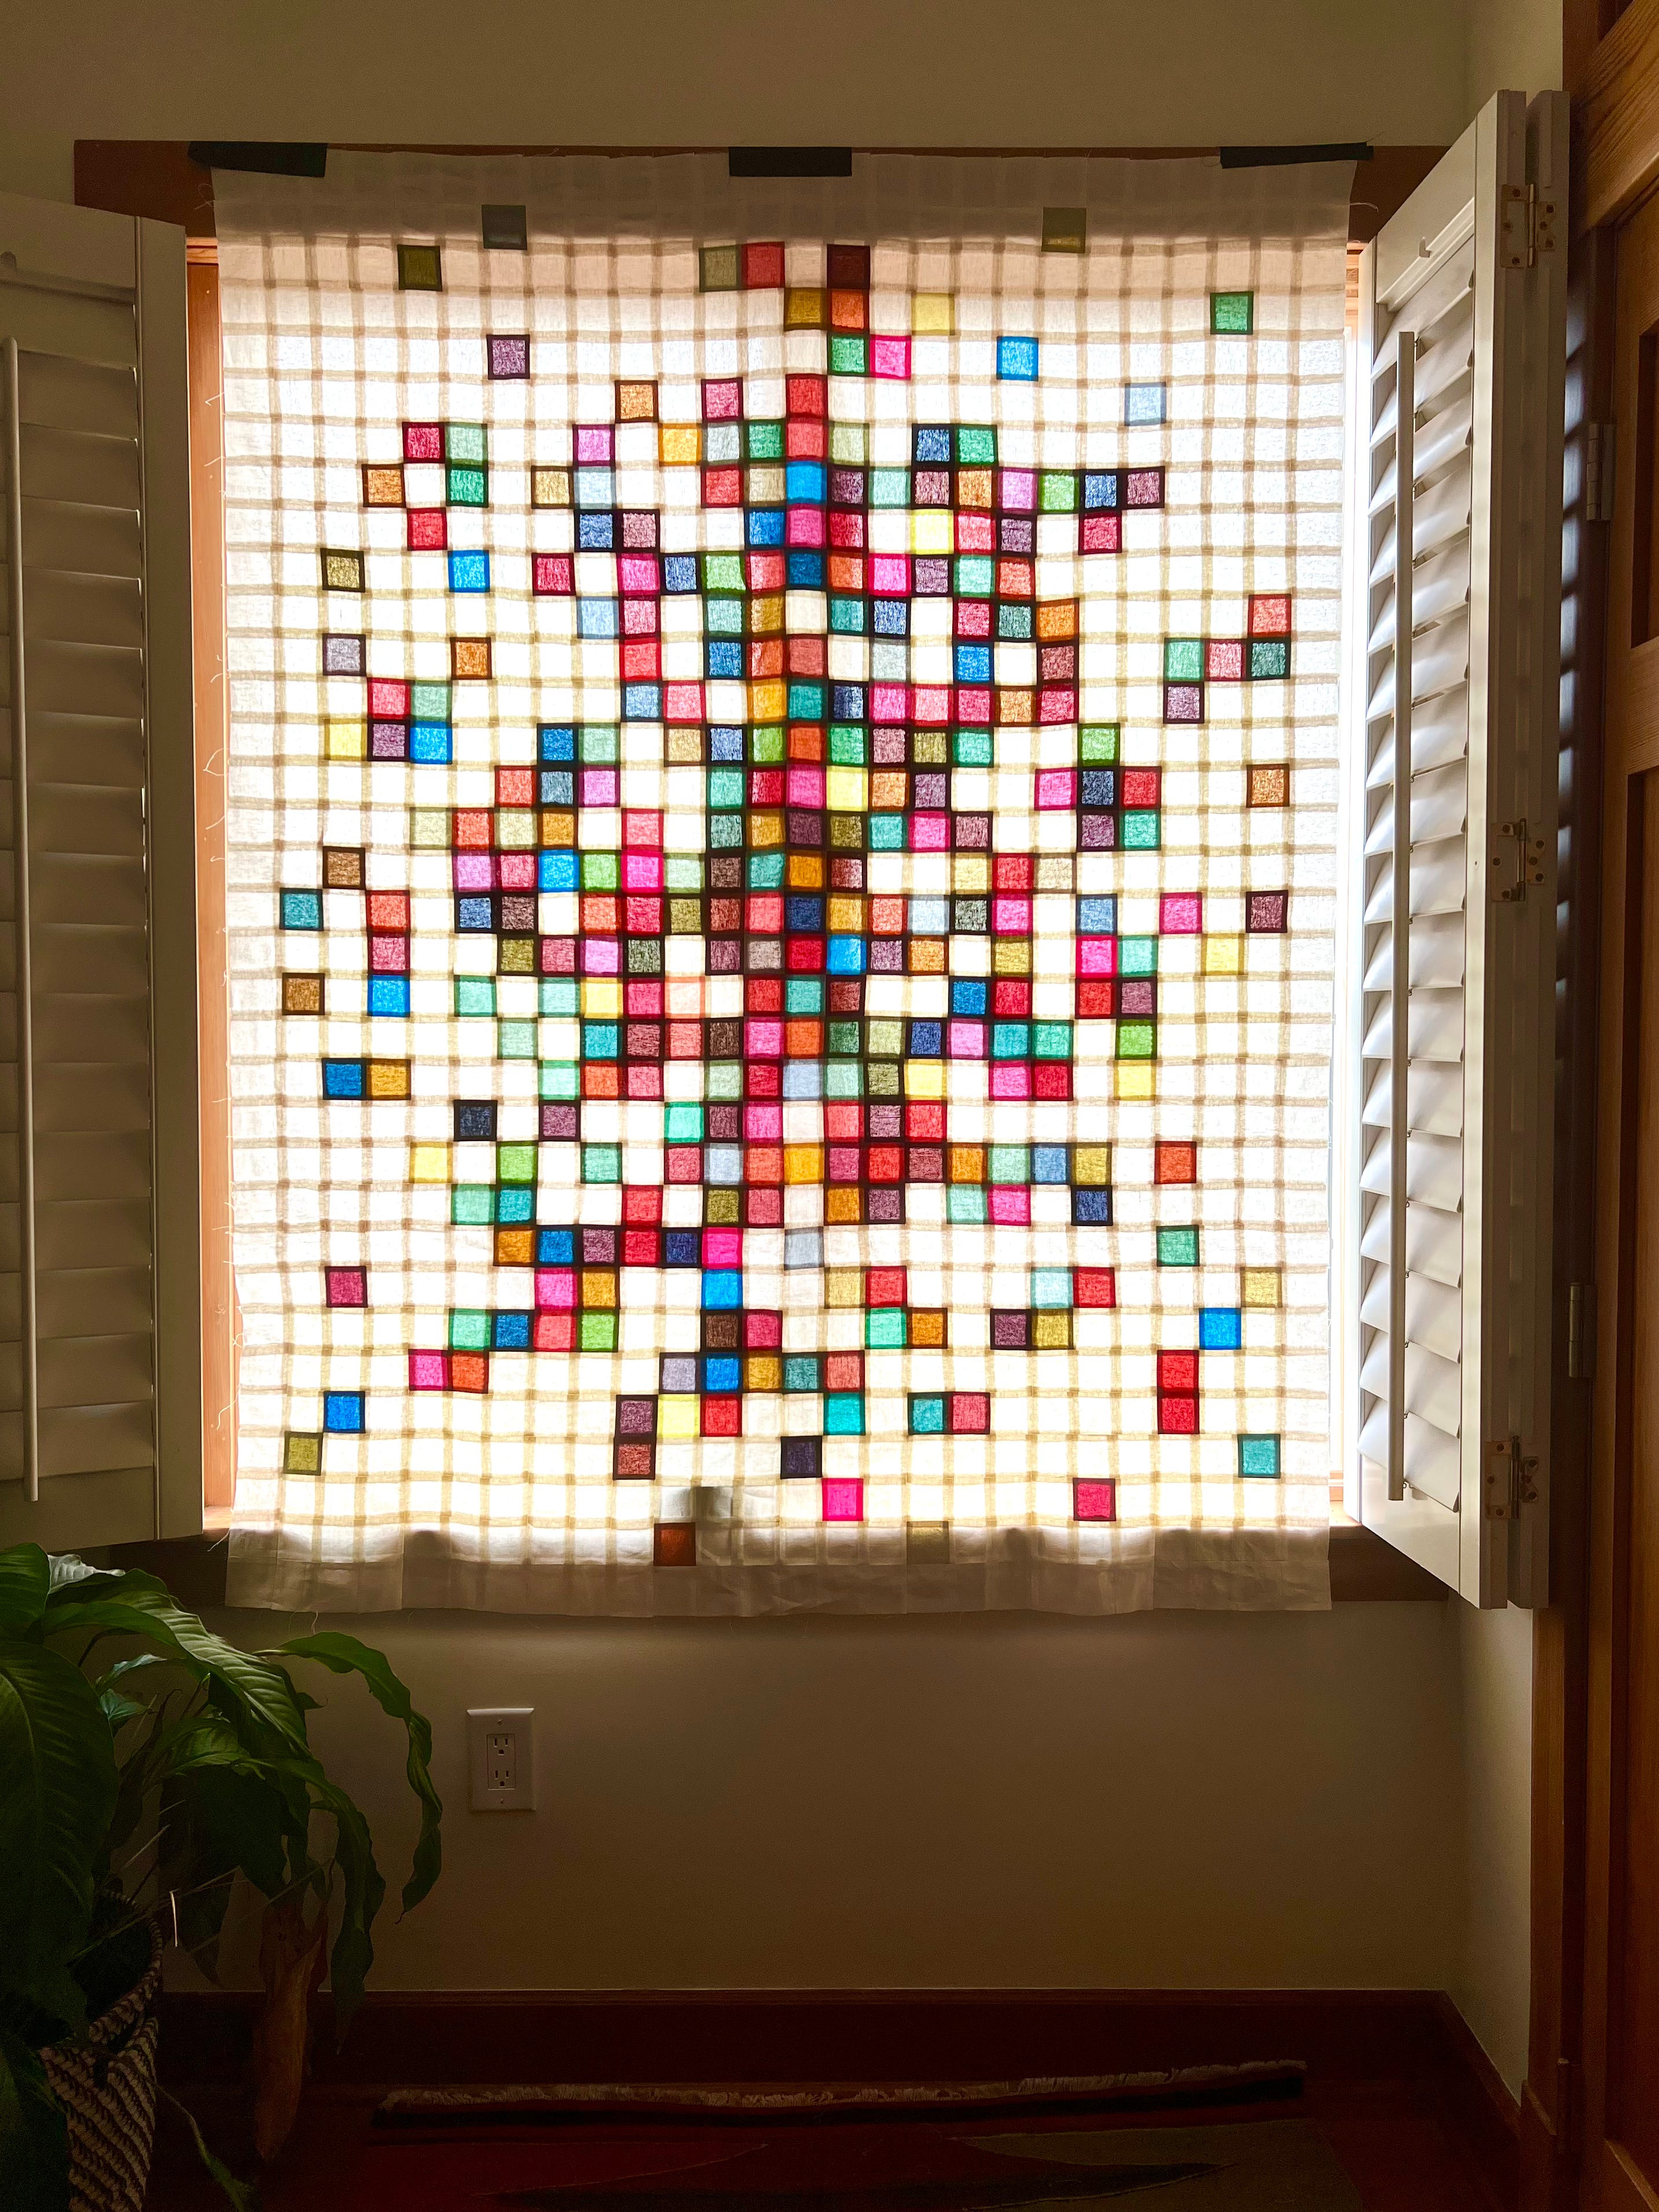
I was drawn to the compositions where Kelly concentrates his colors in the center of the canvas. This gives the eye somewhere to land and feels more inviting and less chaotic than true random placement. Without much information on how Kelly engineered this compositional element, I decided to come up with my own system.
There are a variety of fancy ways to create random, weighted distributions with computer programming, but since I’m not a coder, I decided to use a simple spreadsheet.
First, I made a grid of squares representing the dimensions of my quilt, 24 x 32 squares. Then I created a bell curve of probabilities along the X and Y axes, filling in the entire grid by multiplying the X axis probability by the corresponding Y axis probability. I color coded the results below so you can see how the probabilities change throughout.

Think of each square in this grid as the probability that a color will appear there. There is a low chance at the edges but a higher chance toward the middle. The very center squares have a probability of 1, meaning they are guaranteed to have color.
Next, I needed a way to introduce the element of randomness while also converting the grid into a binary output: color or no color. So I made a second grid the same size as the first and used my spreadsheet’s random number generator function to fill it with random numbers between 0 and 1.
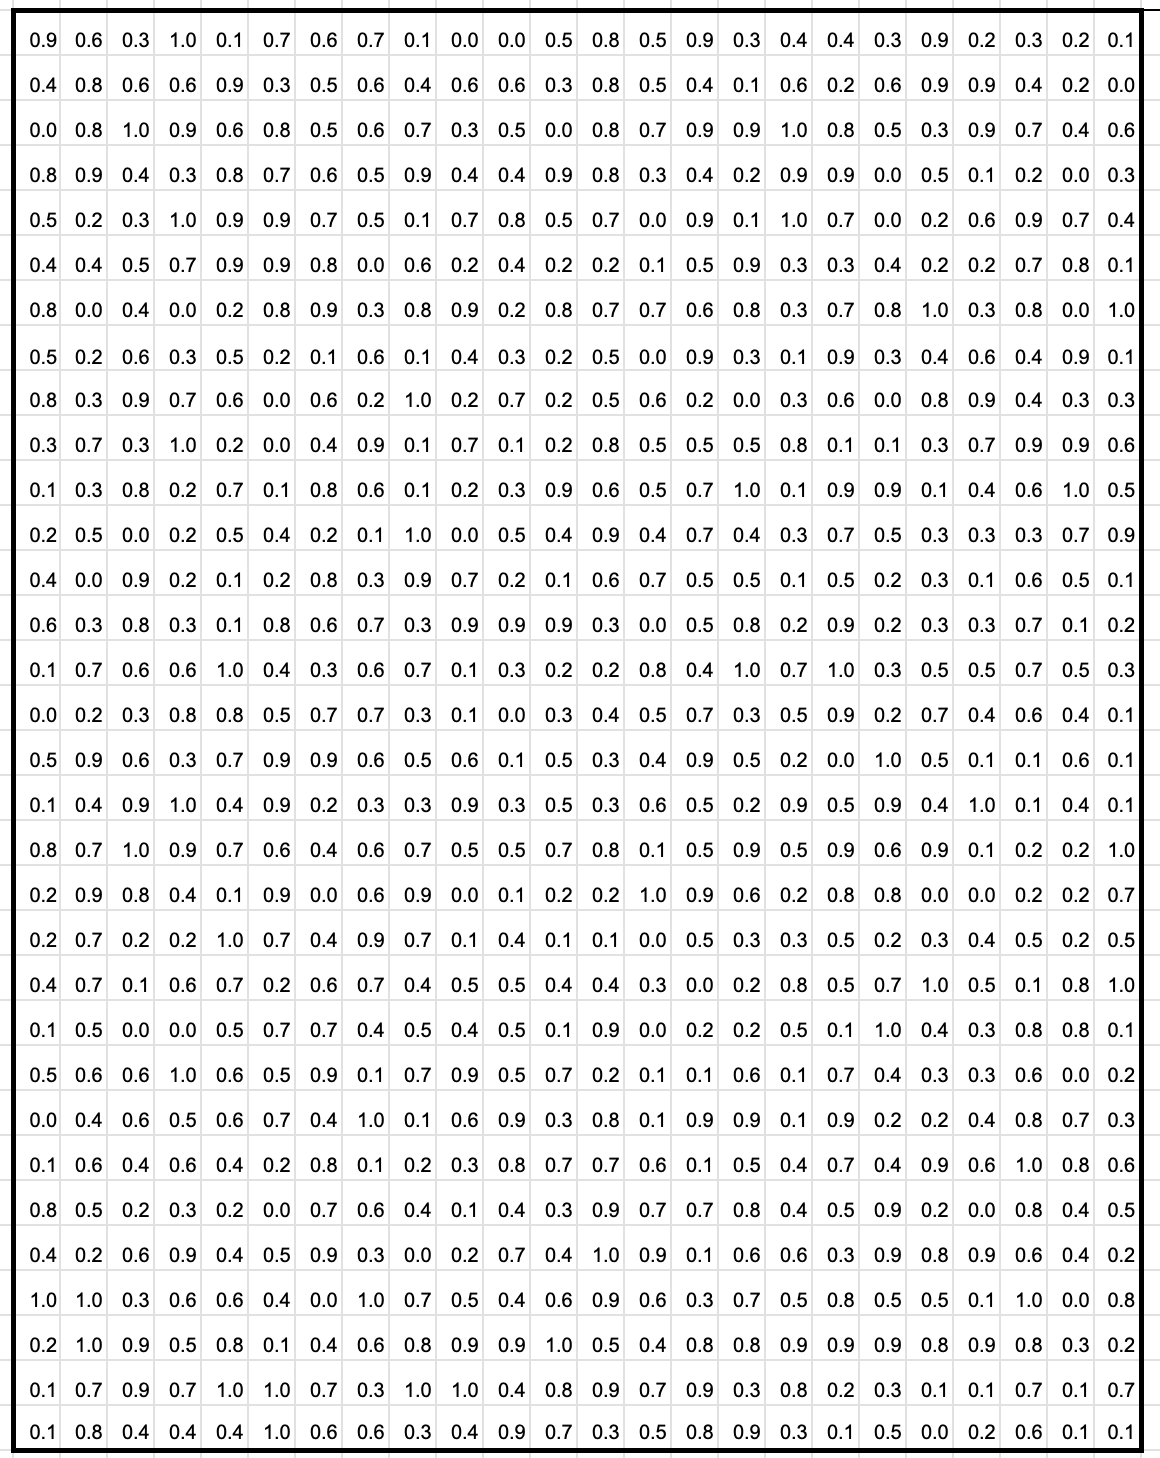
Now to combine them both into a weighted, random distribution. I made a third grid, same dimensions as the other two, and filled it by comparing the probabilities to the random numbers.
Let’s look at this one square at a time. If I take the first square in position A1 on both grids and compare the two, I will have two possible outcomes:
If the probability in Grid 1 is less than than the random number in Grid 2, write a 0.
If the probability in Grid 1 is greater than the random number in Grid 2, write a 1.
In the third grid, every square with a 1 will be a color (to be determined by a random drawing later), and every square with a 0 will be white background.
Here’s an example of the formula I used for cell A1 in the final grid:
=if('Random Numbers Grid'!A1<Probabilities Grid!A1,1,0)Below are two examples of the output. Every time I refreshed the spreadsheet, it populated a fresh batch of random numbers in Grid 2, which generated a new pattern. I saw that there is a surprising amount of variation possible within this system.

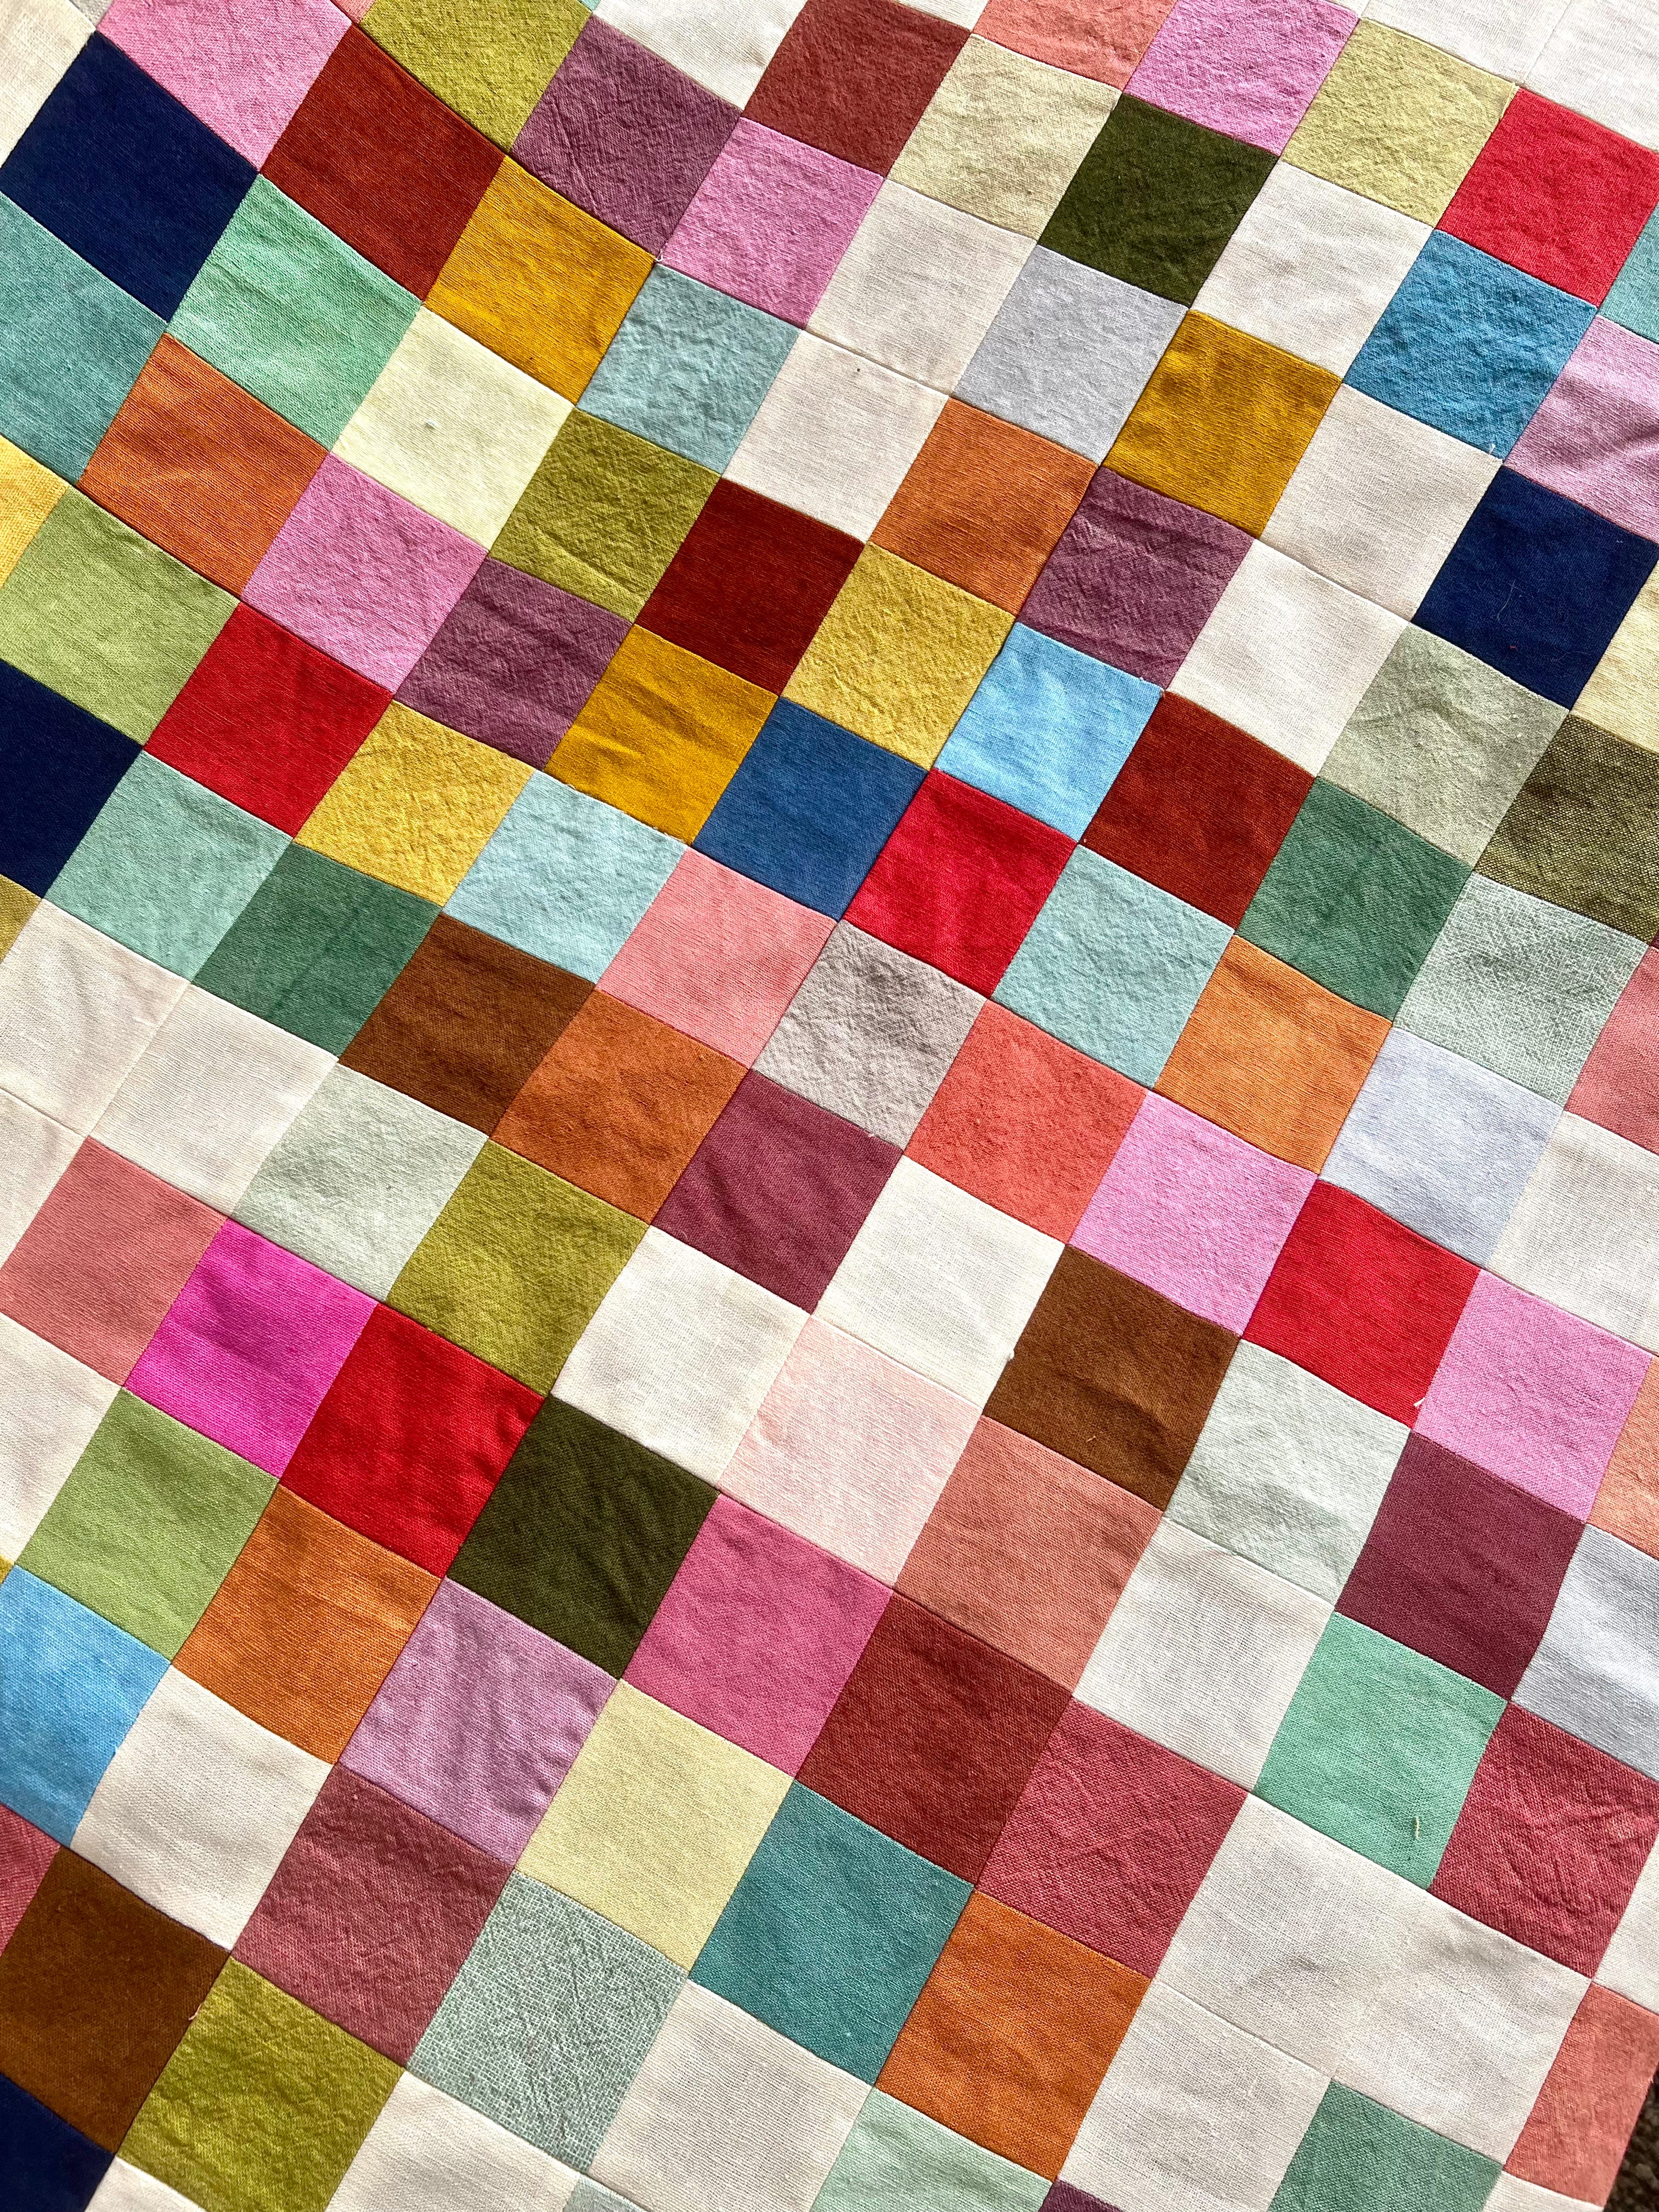
The human brain is exceptional at finding patterns, so I had to refresh my random number grid about a dozen times before I got a distribution that looked sufficiently random enough. Above on the right is an example of the kind of pattern that I immediately discarded; the strong vertical arrangements in the upper half of the quilt are too eye catching. On the left is the winner; it has an even randomness throughout with no strong features or noticeable blank spots.
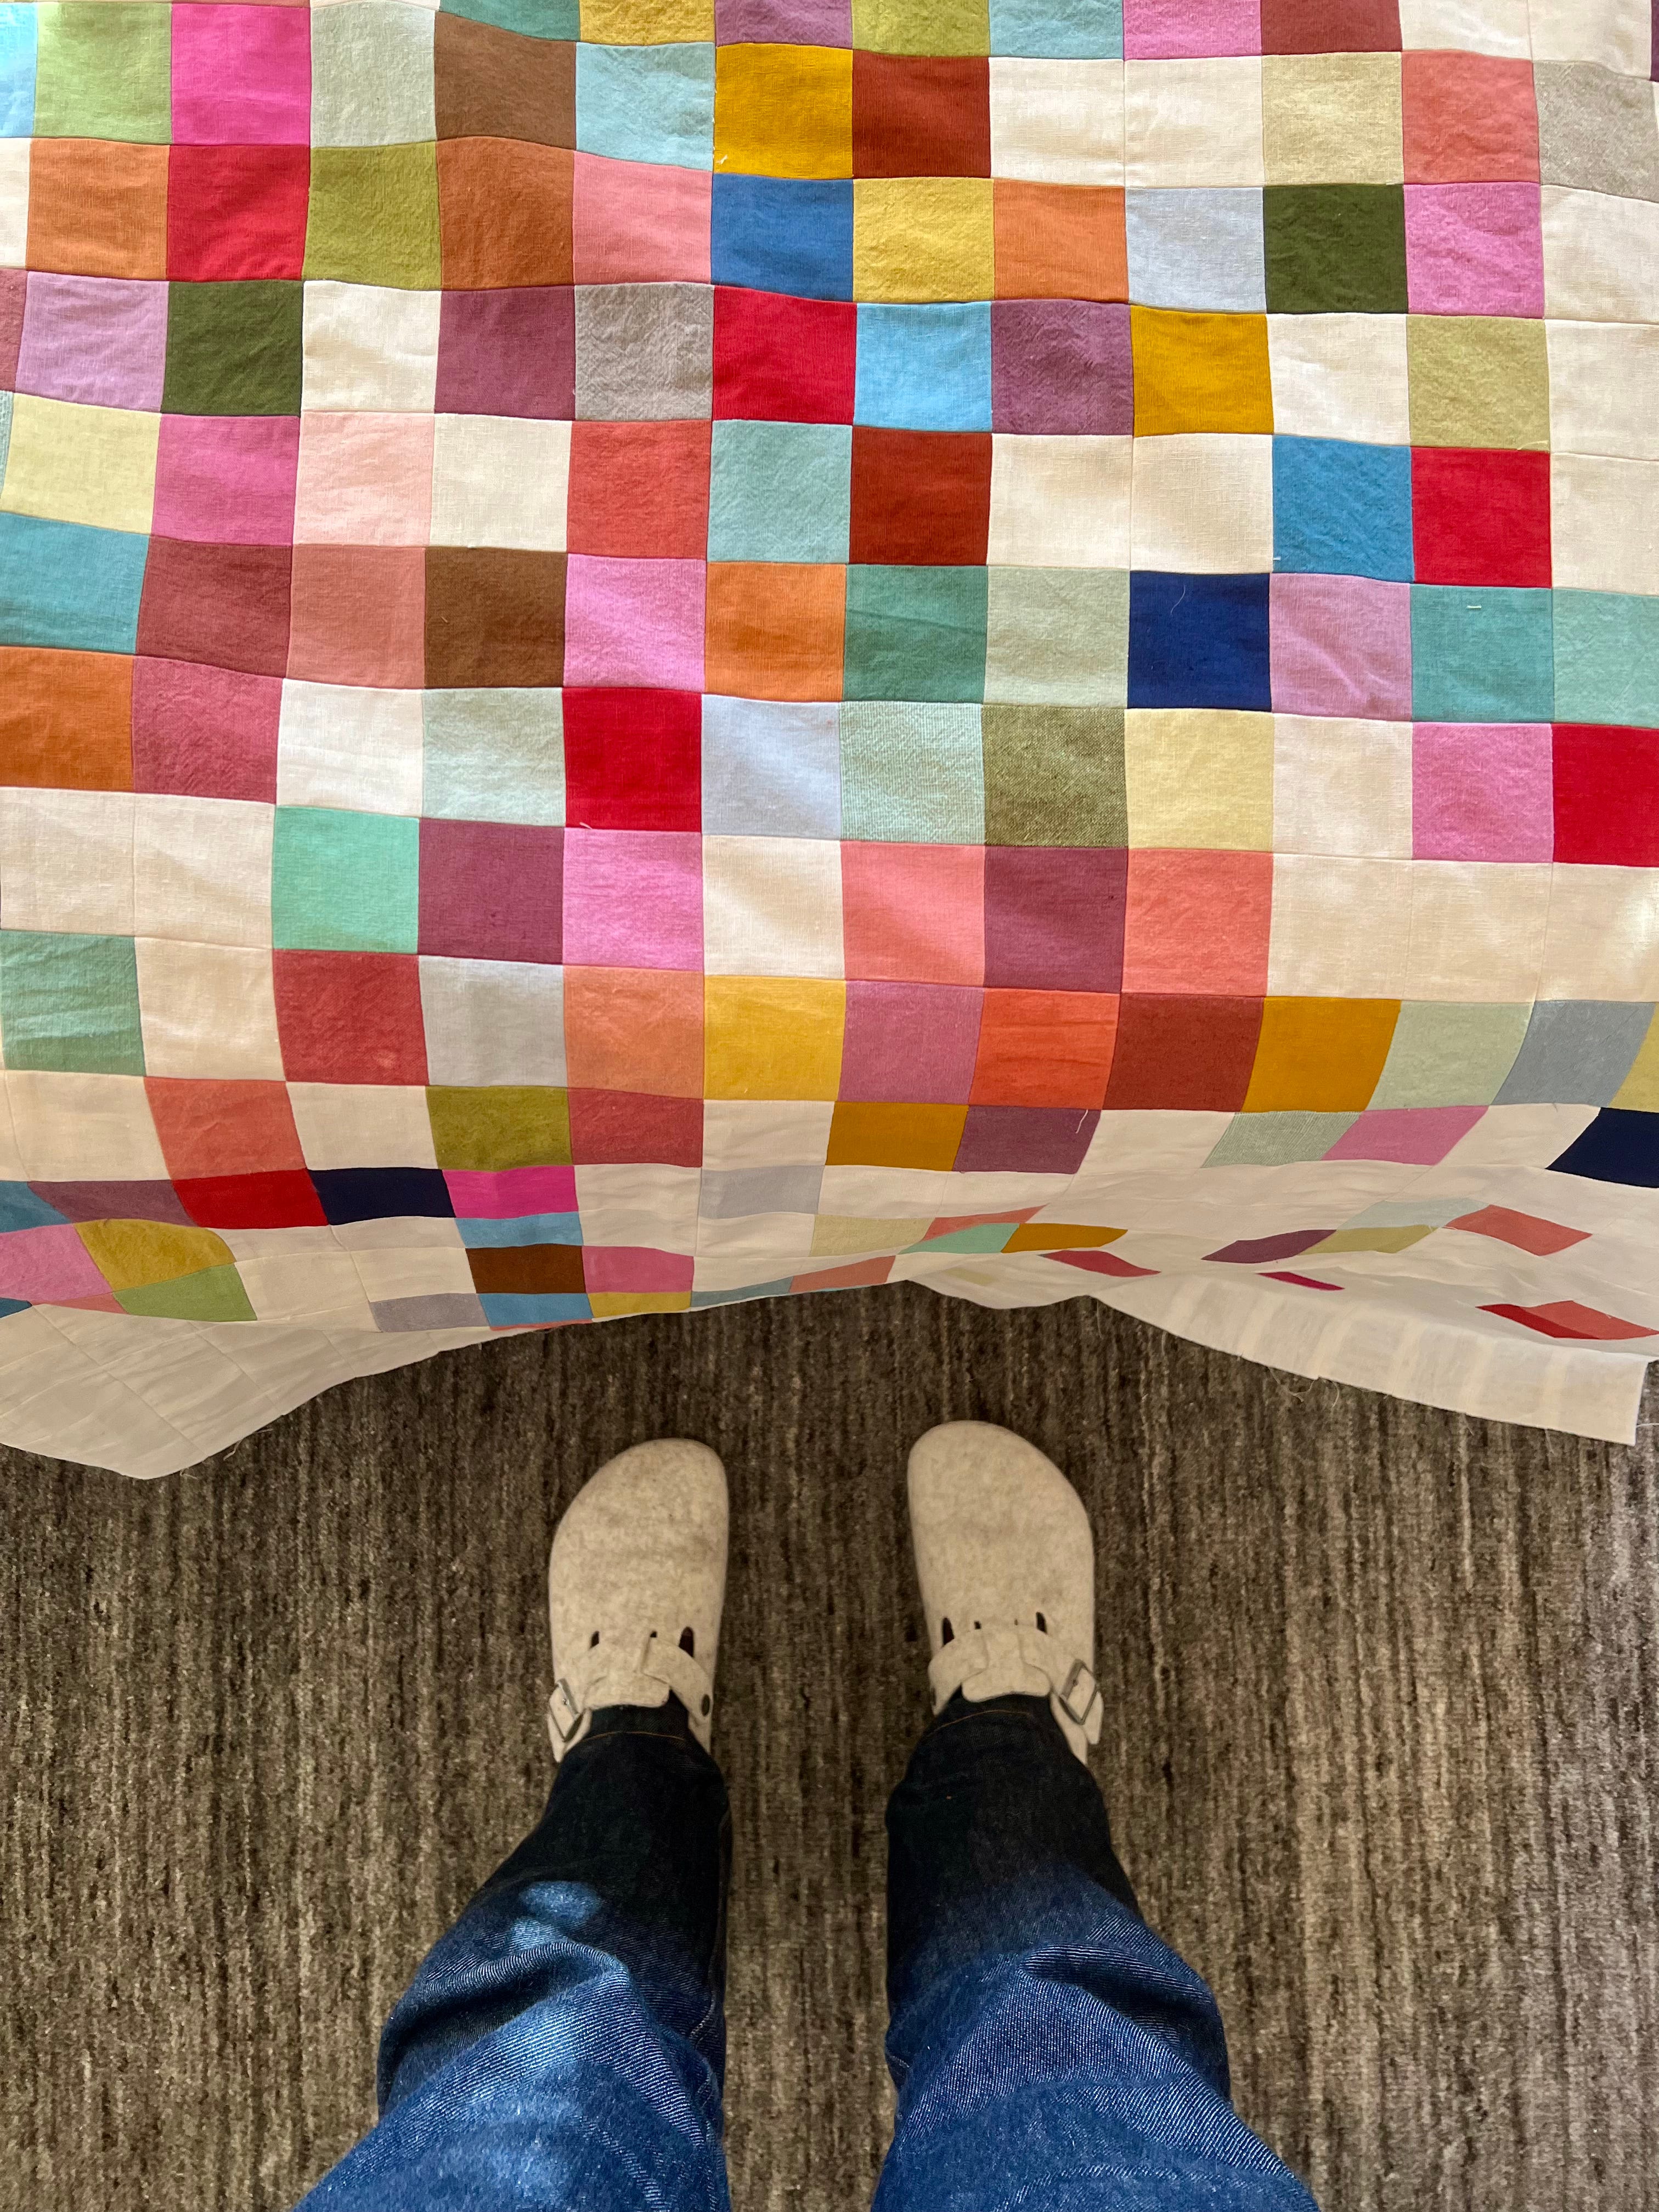
Once I had the winning pattern, I constructed it in 9-patch blocks, making my way from top to bottom. Each time I encountered a “1” square, I pulled a number from a hat to determine which color family would go there. I kept track of the colors as I went so that the same color would not appear next to itself anywhere (Kelly also experimented with this rule).
As I was assembling the quilt, I also had the pleasure of chatting with a follower on Instagram who is a bona fide computer programmer. She was inspired by my original stories about Kelly to code her own app that will generate a random Kelly-inspired quilt pattern. Users can input various parameters like quilt size and whether they want colors weighted in the center or not, and the app will generate beautiful, randomized quilt top patterns. She’s keeping me updated on her progress, and I can’t wait to see the tool once it’s all done. Of course I will share it here, too.
Until next time,
Stacey
Love this! Reminds me of the art math class I took in college. Thanks for sharing.
This I have to play with. I didn’t know it was possible to create a random number generator in a spreadsheet. Going to take a look in Excel. Thank you for the inspiration ☺️